From Dashboard to Decision: How to Use Veterinary Practice Reporting Every Week


Fewer clients are coming in. The ones who do are spending more carefully, declining diagnostics, skipping wellness visits, and pushing back on costs more than practices have seen in years. Meanwhile, visit volume has been declining for four consecutive years across the industry, and raising prices, the strategy that kept revenue afloat for a while, is running out of room as clients push back.
When client traffic slows, the answer isn’t to wait and see. It’s about looking harder at the data you already have: which clients are overdue for a visit, where revenue is leaking, what’s sitting unpaid in accounts receivable, and which services are actually profitable. Most of that information already lives in your veterinary practice management software (PIMS). The question is whether you’re looking at it regularly enough to act on it.
This guide walks through how to build a weekly veterinary practice reporting habit using Digitail.
What Veterinary KPIs Should You Track Every Week?
You don’t need to spend an hour a day on reports. Key veterinary KPIs, financial health, and operational red flags can be covered in 10–15 minutes if you know where to look.
– What you should check daily
– What deserves a proper weekly review
– What to dig into monthly or on-demand
Digitail’s reports map cleanly to each layer, and once you’ve done it a few weeks in a row, it starts to feel less like homework and more like a conversation with your own numbers.
Veterinary Financial Reports: What to Review and How Often
Track Veterinary Practice Revenue
The Sales Report is your single most important weekly number. It shows every sale, its payment and status, discounts applied, taxes, and the total amount due vs. paid with filters by staff, client, invoice, or sale type.
Three things to check every week:
- Total sales
Filter to “Closed” status for a stable, apples-to-apples number you can track week over week.
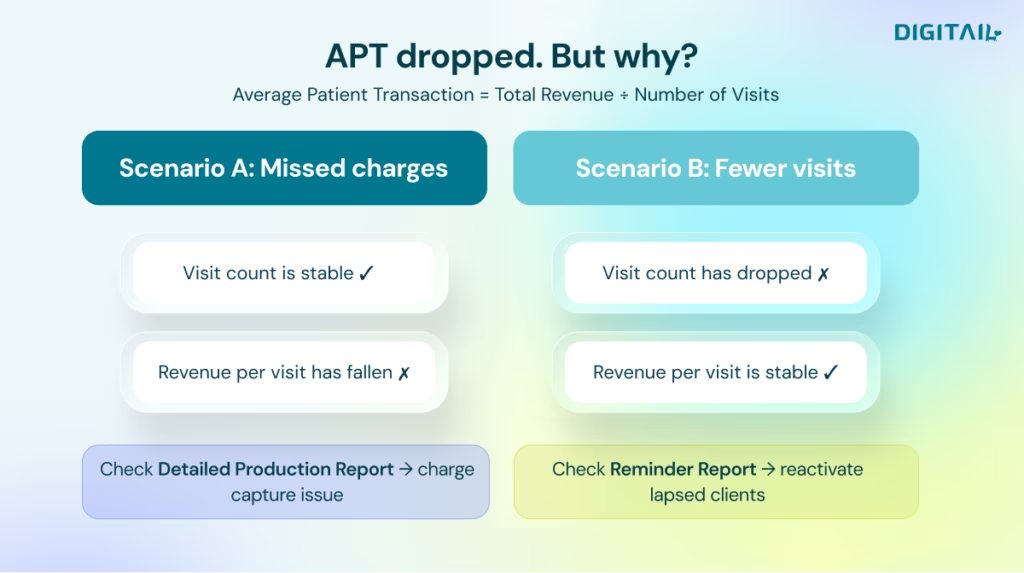
- Average Patient Transaction (APT)
Divide total sales by the number of results. This is one of the clearest veterinary KPIs for tracking care quality and charge capture. According to Veterinary Hospital Managers Association (VHMA) benchmarks a healthy APT for a general small animal practice is typically between $175 and $225; knowing yours tells you where you stand.
- Staff attribution
Which team members are generating revenue, and is the distribution what you’d expect?
Reconcile Veterinary Clinic Cash Daily
This is an easy one to skip, and a painful one to regret skipping. Revenue and cash are not the same thing. The Payments Report shows what actually came in (by payment method, by card type, by date) and flags refunds and reversals in red.
A lot of practice managers look at their sales numbers and feel okay, then get to month-end and find the bank account doesn’t match. The Payments Report, run at end-of-day or start-of-week, catches discrepancies before they stack up.
What to watch:
- Cash vs. card split — useful for reconciliation and register management
- Any refunds or reversals from the prior week
- Credit balances that haven’t been allocated (a positive credit sitting on an account means money that was paid but not applied to a sale)
Manage Outstanding Debt in Your Vet Practice
The Accounts Receivable Report shows every client with an outstanding balance, aged by how long it’s been open: 0–30 days, 31–60, 61–90, 91–120, and 120+.
The 120+ column is the one to watch. Debt that old rarely gets collected without active effort. From this report, you can send a client statement directly by email, add a payment on the spot, or sort by total due to prioritize your collections calls.
Are Discounts Hurting Your Veterinary Practice’s Profitability?
Discounts feel good to give. It’s harder to see the cumulative impact, which is exactly why the Discounts Report exists.
It breaks down every discount, including who gave it, to which client, on what, and at what rate. Filter by staff member to quickly see whether discounting is consistent, policy-driven, or ad hoc.
Questions this report should prompt weekly:
- Which staff members are giving the most discounts, and is there a pattern?
- Are discounts being applied to the right sale types (e.g., staff discounts, loyalty programs) or arbitrarily?
- What’s the total revenue impact of last week’s discounting?
Find Out Which Veterinary Services Are Driving Revenue
If the Sales Report tells you how much, the Detailed Production Report tells you what from. Every product and service charged is broken out by gross sales, discounts, revenue pre-tax, tax, and net sales. It can be filtered by provider, AAHA code, or category.
This is the report to open when you want to answer:
- Is our dental revenue growing or flat?
- What percentage of our income comes from wellness vs. sick visits?
- Which services have the highest discount erosion?
For practices using AAHA codes, this report becomes a strategic tool. You can benchmark against industry standards and identify gaps in service delivery.
Measure Profit Margins With The Sales Analysis Report
The Sales Analysis Report goes one level deeper: it shows the cost of each product sold, the gross profit, and the profit margin on every line item. For products, it pulls cost from the actual batch used. For services, it surfaces pure margin.
This is where practices discover that a high-revenue product category is actually low-margin, or that a service they’ve been underpricing has strong margins and is worth promoting.
Client Retention and Medical Reports
Bring Lapsed Clients Back to Your Clinic
If visits are down industrywide, this report is one of the first places to look for recoverable revenue. The Reminder Protocols Report shows every active reminder (due this month, overdue, or upcoming) along with whether it’s been sent and whether the patient already has a follow-up booked.
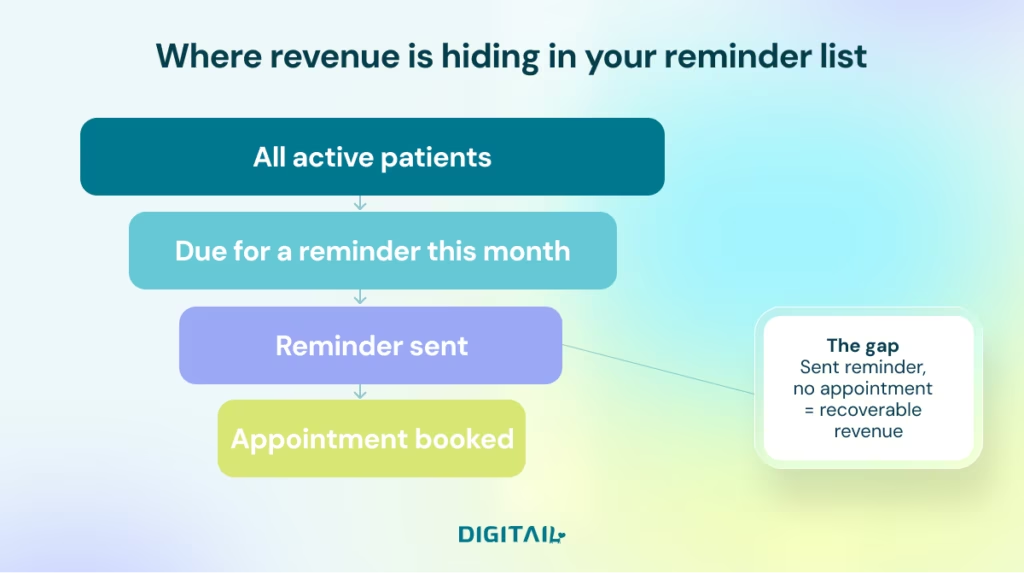
These are not cold leads. These are clients who have already chosen your practice, whose pets are already due for something. The gap between “reminder overdue” and “appointment booked” is almost always just a phone call or a message. A weekly scan of that list is probably the single most underused revenue recovery tool in most practices.
Smart uses:
- Export the list and have your front desk call clients with overdue reminders and no appointment on the books
- Filter by reminder type to run targeted reactivation campaigns
- Cross-reference with the Visits Report to understand which patients have simply drifted away
Use Medical Records Data for Client Follow-Up
The Visits Report gives you a searchable, filterable view of all SOAP records: by date, species, visit type, diagnoses, treatment, and the staff member responsible.
Beyond compliance and record review, this report is useful for:
- Following up with clients after specific diagnoses or procedures
- Identifying patients treated by a specific staff member (useful for quality reviews or when staff changes occur)
- Exporting a CSV to contact clients who visited in a specific period for satisfaction surveys, post-discharge follow-ups, or targeted outreach
Vaccination and Lab Tests Reports
The Vaccination Report and Lab Tests Report are compliance and care-quality tools. The vaccination report shows which patients are current, overdue, or approaching their next due date. The lab tests report shows all orders, status, and results in one place.
Run them weekly to catch gaps: a patient whose rabies is coming due next month, a lab result that’s been pending review, a series vaccination that needs its second dose.
Veterinary Inventory Management Reports
Track Veterinary Inventory and COGS
The Stock Movement Report tracks each product’s opening stock, purchases, sales, adjustments, and closing value, including COGS, at each stage. It’s the report that separates practices that manage inventory from those that simply order reactively.
Inventory management is not just about having adequate stock available to trade, but it can have a massive impact on the financial health of your business.
Use it weekly to:
- Spot products where you’re selling more than you’re buying (stockout risk)
- Identify products where purchases far outpace sales (cash tied up in shelf space)
- Catch manual adjustment patterns that may indicate loss or inconsistent counting
Inventory Oversight and Compliance
The Product Report gives a broad overview of your stock: what’s in, what’s out, and what’s been adjusted. The Controlled Substances Report is non-negotiable for compliance. It tracks every use of controlled drugs, who administered them, and in what quantities.
In many jurisdictions, controlled substance logs are a regulatory requirement. Having this automated and auditable in Digitail removes a significant compliance burden.
Operational Reporting
Identify Bottlenecks in Your Clinic Workflow
The Flowboard Report shows exactly how long each patient spent in every stage of their visit: waiting, in exam, in hospital, pending checkout. It surfaces average wait times by visit type and flags late check-ins.
This is the report that answers the uncomfortable questions:
- Are our wellness appointments actually running efficiently, or is the doctor perpetually behind?
- Is the checkout process a bottleneck?
- Are no-shows concentrated in a particular time slot or day?
Operational waste is invisible until you measure it. The Flowboard makes it visible.
Your Vet Clinic KPI Dashboard in One View
The Clinic Performance Metrics Dashboard consolidates the veterinary KPIs that matter most into a single, visual overview. It tracks on a 12-month trailing basis:
- Total revenue by week, month, and quarter with gross profit trends
- Average revenue per visit by visit type
- Top 10 AAHA revenue codes to see which services drive your income
- Appointment fill rate shows the percentage of available slots that are booked
- Canceled and no-show rate
- Treatment plan acceptance (created vs. signed vs. synced)
- New clients year-over-year
- Referral sources — where your new clients are coming from
Now we can get a real-time snapshot of what’s going on with our business, quickly identify trends, gauge efficiency, and make data-driven decisions. Tasks that previously consumed two weeks now require just five minutes.
Dr. Joshua Gehrke, Veterinary United
Open this dashboard weekly. If your fill rate is dropping, appointment source data might tell you whether online booking is underperforming. If revenue is flat despite strong appointment volume, APT or the production report will tell you why.
Control Labor Costs in a Veterinary Practice
Labor is typically a practice’s largest expense after drugs and supplies. The Timesheet Report lets managers review, filter, and export staff hours, including breaks, to show actual worked time vs. scheduled time.
Combined with the Appointments Report and fill rate data, this tells you whether staffing levels are matching demand or whether you’re paying for hours that aren’t generating value.
Reconcile Daily Transactions in Your Vet Clinic
The Accounting Ledger shows daily opening balance, all transactions, and the closing balance — the equivalent of a cash register tape for your whole clinic. The Accounting Ledger Operations view lets you add, edit, or remove entries.
For practices that reconcile daily, this is the tool. For those who do it weekly, it’s where discrepancies from Monday to Sunday get resolved before they become a month-end headache.
Reporting for Multi-Location Veterinary Groups: Cross-Clinic Visibility at Scale
For veterinary groups running multiple locations, practice reporting is about standardization and control. Digitail is built to give enterprise groups cross-clinic visibility without requiring a separate analytics stack.
The same reports that run at the clinic level can be filtered and compared across locations , identifying which site has the strongest APT, which has the most outstanding receivables, where no-show rates are highest, or where controlled substance documentation needs tightening.
For groups that need to go deeper with custom dashboards, Power BI integration, or automated cross-location reporting, Digitail Redshift provides direct, secure access to raw structured data via Amazon Redshift. Your BI team can connect tools like Tableau or Looker and build exactly what your board or investors need.
Redshift is ideal for multi-site groups with internal data or BI resources who need to combine Digitail data with accounting, HR, or marketing systems.
One operating system for every clinic you run.
Standardize care, stop revenue leakage, and get real-time visibility across your entire footprint without adding friction for your clinical teams.
How Often Should a Veterinary Practice Review Its Reports? A Practical Schedule
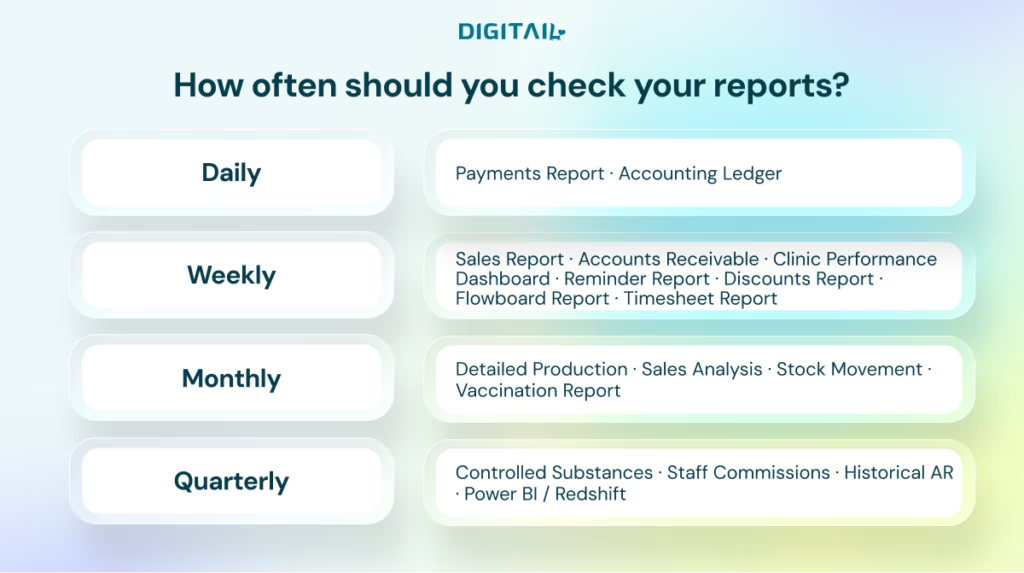
You don’t need to look at every report every week. Here’s a realistic starting rhythm:
The goal isn’t to be buried in data. It’s to have a short, structured routine where a few key numbers confirm the clinic is on track or flag where it isn’t, early enough to do something about it.
Why Data-Driven Veterinary Practice Management Matters More Now
Reports don’t make decisions. They just close the gap between what’s actually happening in your practice and what you think is happening.
In a climate where visits are down and clients are more cost-sensitive than they’ve been in years, the margin for running blind is smaller. The data is already there. Digitail captures it every time a record is closed, a payment is taken, a vaccine is administered, or an appointment is canceled. The only question is whether you’re looking at it and doing something with it while there’s still time to act.
FAQ
The core veterinary KPIs to track weekly are Average Patient Transaction (APT), appointment fill rate, accounts receivable aging, and total closed sales. Monthly, add gross profit margin by service, client retention rate, and new client acquisition. The Clinic Performance Metrics Dashboard in Digitail surfaces most of these automatically.
Payments and the Accounting Ledger daily; Sales Report, Accounts Receivable, and the Performance Dashboard weekly; Detailed Production and Sales Analysis monthly. A consistent weekly routine of 10–15 minutes catches most problems before they become expensive ones.
APT is total revenue divided by number of patient visits. It measures how much revenue your practice generates per appointment and is one of the most reliable indicators of charge capture quality and standard of care. A sudden drop in APT usually signals missed charges, not a drop in patient volume.
Yes, and it should! Spreadsheets require manual data entry, break when someone makes an error, and are always looking backward. Veterinary practice management software like Digitail captures data in real time and makes it available in structured, filterable reports the moment a record is closed or a payment is taken.
Digitail gives multi-location veterinary groups the ability to run and compare the same reports across all sites: APT by location, outstanding receivables by clinic, no-show rates, controlled substance logs, and more. For groups that need custom dashboards or BI integration, Digitail Redshift provides direct access to raw structured data via Amazon Redshift.